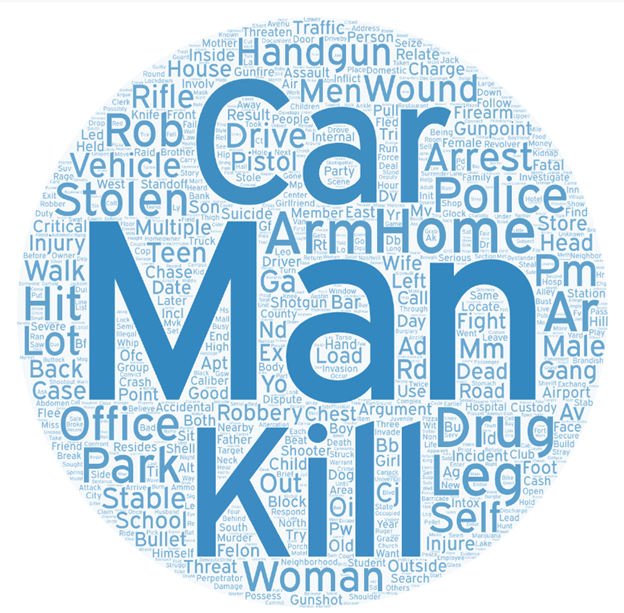
66% of incidents had a completed "notes" field, on which we conducted text analysis. Words deemed too "generic" were removed. Some noteworthy observations:
The brightest spot of the heat map is in Chicago, Illinois. There tend to be few bright clusters in rural, more sparsely populated regions, as opposed to more hot spots of gun violence incidents in larger, more urban areas along the East Coast, Chicago, and along the West Coast.
When a clustering analysis was performed on a state level, the gun violence cluster (states in red) consisted of Alabama, Alaska, Deleware, Illinois, Louisiana, Mississippi, Missouri, South Carolina, and Tennessee. Washington DC was a massive outlier in terms of gun violence, and was removed from this clustering analysis in order to not skew the results. Of the 9 states in the final gun violence cluster, only Deleware and Illinois are historically "blue" (Democrat) by political affiliation, while the remaining 7 are traditionally "red" (Republican). Illinois is the only state with licensing requirements for gun purchase or possession.
Red cluster center: 0.00138815
Yellow cluster center: 0.00068977
Clustering analysis of poverty levels in each Congressional District showed 3 distinct groups, labeled 0, 1, and 2, which represent highest to lowest poverty levels.
Poverty Rate cluster centers:
49 of the 435 Congressional Districts were categorized into the cluster pertaining to higher proportions of gun violence.
Of the 189 Districts in the cluster with the lowest poverty rates (cluster 3), only 1 of them appeared in the 49 Districts identified as most violent (Alaska, at large).
Fairly even split among the remaining 48 Districts between clusters 1 and 2.
Gun violence cluster centers:
We can see some seasonality in the dataset, which seems like there’s high peaks around summer time; and it seems to be increasing slightly over the years.
To build the model for prediction, we started with grouping data into weekly counts, and ended up with 222 weeks of data from 2014 to 2018 March. Since the variance isn’t stable, and there’s seasonality trend, we transformed data by taking log, seasonal difference, and regular difference. Looking at the model residual ACF and PACF plots, we decided the models of MA10 and AR 4 to move forward with. Lastly, we implemented step and pulse intervention for prediction. Intervention helps taking into account some special or unexpected events in the time series to build better models. The lower the AIC score indicates the better performance of the model. In this case, the AR4 model has the better prediction.
In this case, the MA1 model has the better prediction.
In this case, the MA11 model has the better prediction.
We can also use the method to analyze individual states. In this case, we did a injury prediction on Illinois, the highest case state in the US. In this case, the MA1 model has the better prediction.
Most incidents did not have data on type of gun used (130,000+). Of the identified guns used, handguns were by far the most common weapon in over 25,000 incidents. The next most common gun used was a 9mm, which occurred in 6448 incidents.
Most guns in our data had an unknown status of ownership (around 170,000), while incidents with stolen guns came in at just under 20,000, and very few known "not-stolen" status.
Suspect age distribution is in red, and victim age distribution is in blue. Overall, there were more suspects (195,913) than victims (189,600), indicating more suspects were involved per gun violence incident. The peak age distribution is from 17-27 years old.
Most suspects were adults 18 years of age and older (151,072). 12,850 suspects were teenagers between the ages of 12 and 17. 31,413 incidents did not have data on suspect age group.
There were only 8,476 female suspects, compared to 100,297 male suspects.
Most victims were adults, ages 18 and up.
There were around 10,000 more female victims than female suspects, with 18,349. Once again, there were far more male victims, with 87,082.
Mass shootings accounted for the fewest (26 total; 13 each for random victims and known victims). Armed robbery accounted for the most, followed by family and significant others (current or former). Most cases actually seemed to involve relationships in which the suspect(s) and victim(s) knew each other.
Unharmed, -Arrested accounts for the most, followed by unharmed and then arrested. That there are 19543 suspects that are only “unharmed” and not arrested is in line with the literature which suggests that many perpetrators of gun violence do not receive appropriate consequences.